Weighted gene co-expression analysis describes the correlation patterns among genes. This example demonstrates how to use the WGCNA package for the R statistical computing environment to import human microarray data, preprocess the probes into a suitable form, and perform a standard correlation analysis.
Data Import: data is read from the CSV files describing probes, samples, and expression values available for download on the human microarray download page: http://human.brain-map.org/static/download.
Data Preprocessing: probes are filtered such that a single probe is
selected to represent each gene using WGCNA's collapseRows function
and genes without entrez ids are removed.
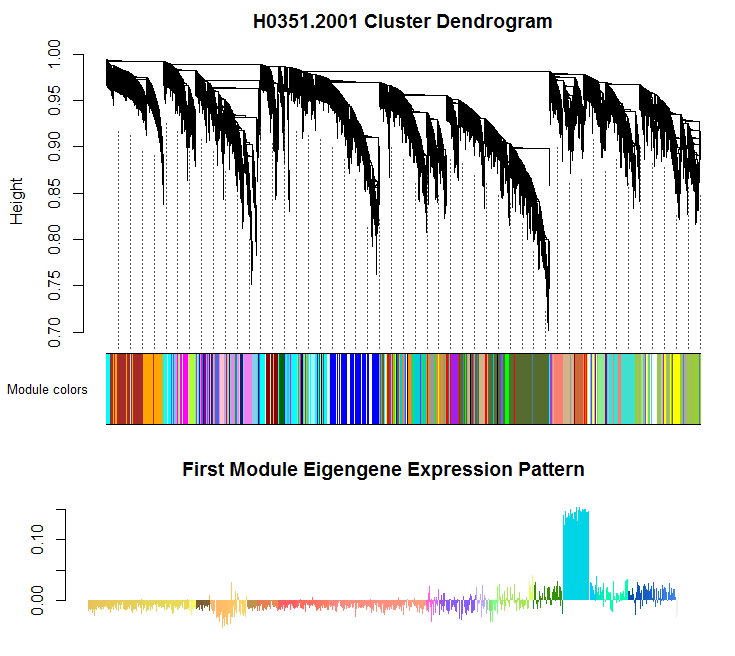
Correlation Analysis: standard analysis results include a set of clustered gene modules and module eigengenes, which represent the expression pattern for a module. The top of the figure depicts the clustering dendrogram and module assignment. The bottom of the figure shows the expression pattern of the first module eigengene, which shows strong differential expression between the cerebellum and the rest of the brain.
Documentation and Resources
| api.R | Methods for making API queries. |
| preprocessData.R | Method for importing and preprocessing human microarray data. |
| human_ma_demo.R | Script for performing WGCNA analysis. |
| wgcna.tar.gz | Archived source code. |