This demo consists of several Matlab scripts demonstrating how to download human microarray expression values from the API and correlate them with a brain activation image computed using the Statistical Parametric Mapping (SPM) Matlab package. Samples are transformed through MNI space into an SPM image, where they are correlated with average regional activation values.
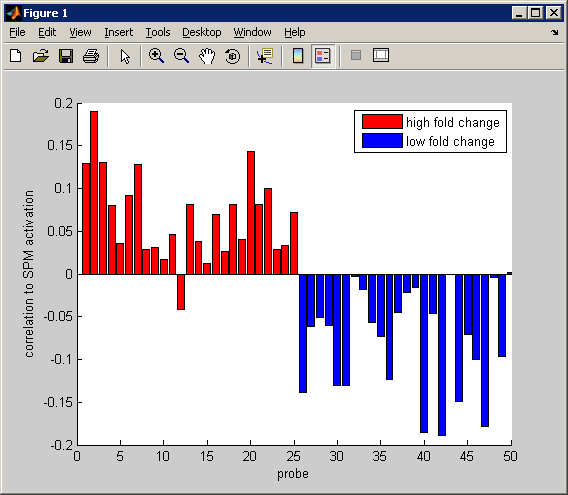
The chosen activation map is the result of a visual stimulus, so the activation is primarily bright in brain regions known to be related to visual processing. The probes presented in the demo are the result of differential searches for structures with relatively high and low expression in vision-related structures (cuneus and lingual gyrus). As expected, the highly expressed genes are positively correlated with the activation map while the unexpressed genes are negatively correlated with the activation map.
Documentation and Resources
| spm_correlation_demo.m | SPM correlation launch script. |
| download_specimen.m | Script for downloading meta information on a Specimen. |
| download_expression.m | Script for downloading expression values for a set of probes. |
| expression_spm_correlation.m | Script for correlating a set of samples to an SPM image. |
| get_api_path.m | Script that returns the path to the API. |
| transform_samples.m | Transform a set of samples by a given matrix. |
| spm.tar.gz | Archived source code. |