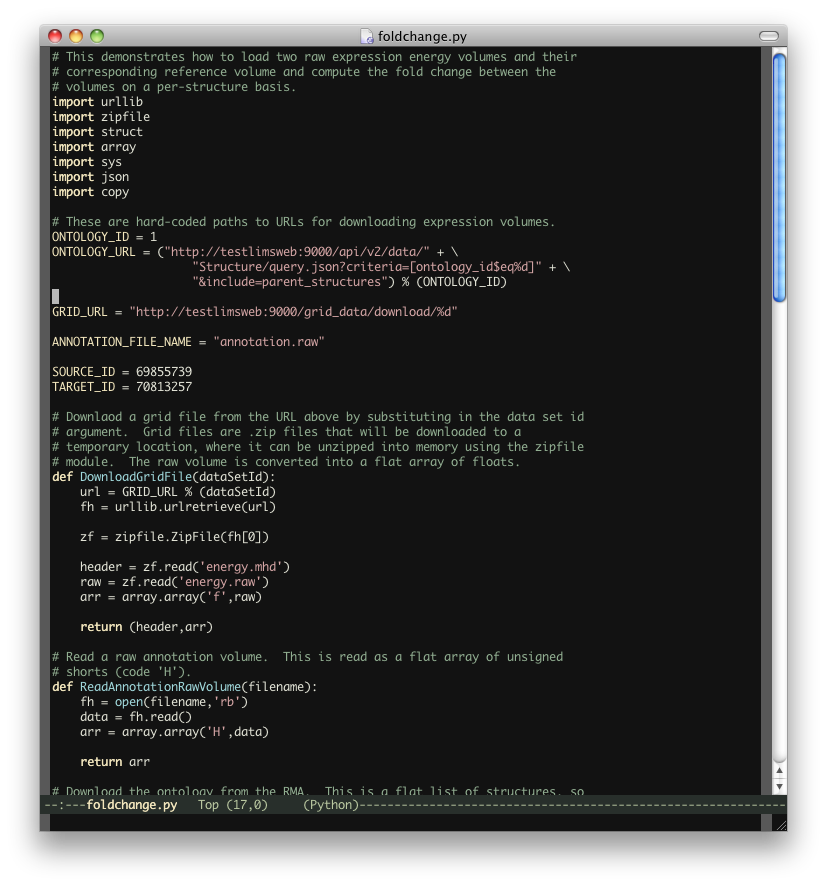
The grid service API allows users to download a compressed archive containing an expression energy volume and XML description for a dataset. This example demonstrates how to read two of those volumes in Python and compute the fold change between them for all structures in our ontology.
After downloading the expression volumes, parsing our ontology, and reading the reference annotation volume (which associates a voxel with a structure id), the Python script iterates through the expression energy volumes and computes mean expression energy within each structure. Mean expression energy for higher level structures is computed by having all child nodes contribute expression energy to their parents.
With the mean expression energy for all structures computed, fold change is simply the ratio of the two expression energies in each structure. The script prints these out in CSV format for easy import into analysis applications.
Documentation and Resources
| foldchange.py | Data importing and processing documentation. |
| foldchange.tar.gz | Archived source code. |