The grid service API allows users to download a compressed archive containing an expression energy volume and XML description for a dataset. This example demonstrates how the open source Visualization Toolkit and Qt application user interface framework can be used to visualize expression volumes as both pseudocolored axis-aligned slice views and a 3D colored volume renderings. The reference atlas can also be displayed as a maximum intensity projection.
The application is written in a few hundred lines of C++ code that can be compiled on all major platforms including Windows, Mac OSX, and Linux using the CMake build system. Note: this application is only guaranteed to work with the Qt and VTK versions described in the compilation instructions.
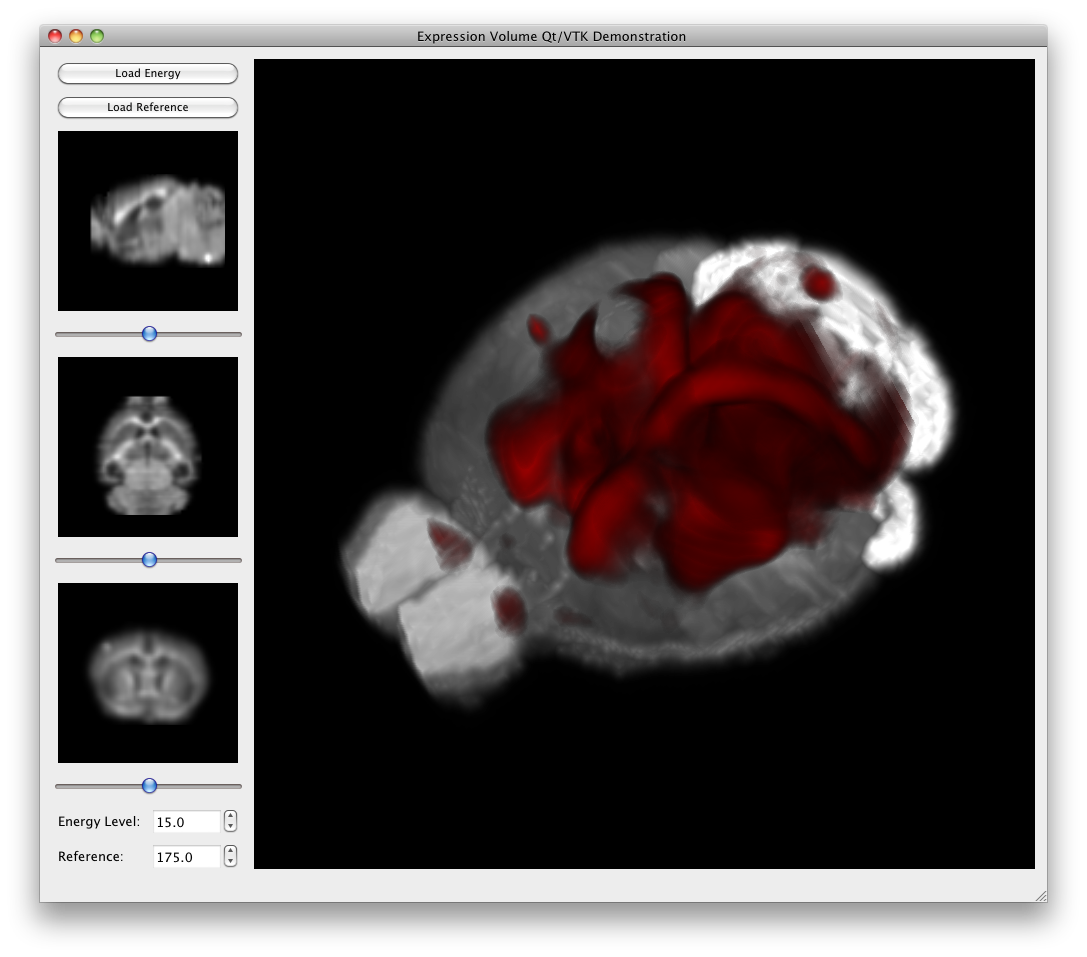
Usage
Download a grid file archive and its associated reference volume. Click the Load Energy and select the energy mhd file. The colored volume rendering is adjustable via the Energy parameter in the lower left. Click Load Reference and select the reference mhd file. The volume rendering intensity is adjustable via the Reference parameter in the lower left.
Documentation and Resources
| download_data.py | Python script for downloading a grid volume and the reference volume. |
| MainWindow.cxx | Documentation for user interface implementation file. |
| MainWindow.h | Documentation for user interface header file. |
| main.cxx | Documentation for application initialization. |
| Compilation | Application compilation instructions. |
| volume.tar.gz | Archived source code. |